缘起
今天公司的顾问写了一段Python用于大量作图并保存在本地,但是运行了一段时间后出现快速的内存泄露,本文还原内存泄露发现的过程。
建议
如果不想看过程,使用这些建议可能会解决90%的Matplotlib后台绘制导致的内存泄漏问题
- 使用
matplotlib.figure.Figure代替matplotlib.pyplot.figure - 保存图片用
figure.savefig代替plt.savefig - 使用非互动式后端
matplotlib.use('agg') - 及时关闭绘制资源
figure.clf()plt.close(figure)
过程
发生的环境是:
python==3.7.7
matplotlib==3.5.3
numpy==1.21.1
pandas==1.3.5
seaborn==0.12.2
代码涉及商业代码我就用一段测试代码代替了:
import pandas as pd
import numpy as np
import seaborn as sns
import matplotlib.pyplot as plt
import os
import gc
import uuid
import time
import timeit


class ChartHelper:
    def createImg(self,chart_key, data, folderPath_Scatter):
        df = pd.DataFrame(data)
        self.createScatterImg(chart_key,  df,folderPath_Scatter)
        plt.close('all')
        df=None
        data=None

    def createScatterImg(self,chart_key,df, folderPath):

        num_series = df.shape[1]
        print("scatter")
        figure = plt.figure(figsize=(12, 8))  # 你可以根据需要调整图形大小
        grid = plt.GridSpec(num_series, num_series, figure=figure, hspace=0.1, wspace=0.1)  # 调整间距
        # 绘制散点图
        for i in range(num_series):
            for j in range(num_series):
                ax = figure.add_subplot(grid[i, j])
                ax.scatter(df.iloc[:, j], df.iloc[:, i],s=3,color='black', alpha=0.5)
                ax.set_xticks([])  # 隐藏x轴刻度
                ax.set_yticks([])  # 隐藏y轴刻度
                if i == num_series - 1:  # 最下方的图显示x轴标签
                    ax.set_xlabel(df.columns[j])
                if j == 0:  # 最左侧的图显示y轴标签
                    ax.set_ylabel(df.columns[i], rotation=0, labelpad=15)


        # 保存散点矩阵图为图片
        t_start = timeit.default_timer()
        plt.savefig(os.path.join(folderPath, chart_key+'_scatter_matrix.png'),dpi=10)
        figure.clear()
        figure.clf()
        figure=None
        plt.clf()
        plt.close('all')
        gc.collect()
        t = timeit.default_timer() - t_start
        print(t)

        print("heatmap")
        correlation_matrix = df.corr()
        figure=plt.figure(figsize=(8, 6))

        # 绘制相关性热图
        sns.heatmap(correlation_matrix, annot=True, cmap='coolwarm')


        # 保存相关性热图为图片
        t_start = timeit.default_timer()
        plt.savefig(os.path.join(folderPath, chart_key+'_correlation_heatmap.png'),dpi=10)
        figure.clear()
        figure.clf()
        figure=None
        plt.clf()
        plt.close('all')
        gc.collect()
        t = timeit.default_timer() - t_start
        print(t)


if __name__ == "__main__":
    np.random.seed(0)
    data = np.random.rand(4, 8)
    df = pd.DataFrame(data)
    chart = ChartHelper()
    for i in range(5):
        for j in range(50):
            print(i,j)
            chart.createImg(data=df,folderPath_Scatter="download",chart_key=str(uuid.uuid4()))
        time.sleep(20)
顾问原本是写C#的,不知道聪明的你有没有看出问题在哪里。其实罪魁祸首都藏在createScatterImg方法中。
我呢,直接上三板斧
第一步 确定是否存在泄露
安装工具
pip install memory_profiler
在犯罪嫌疑人createScatterImg加上装饰器@profile
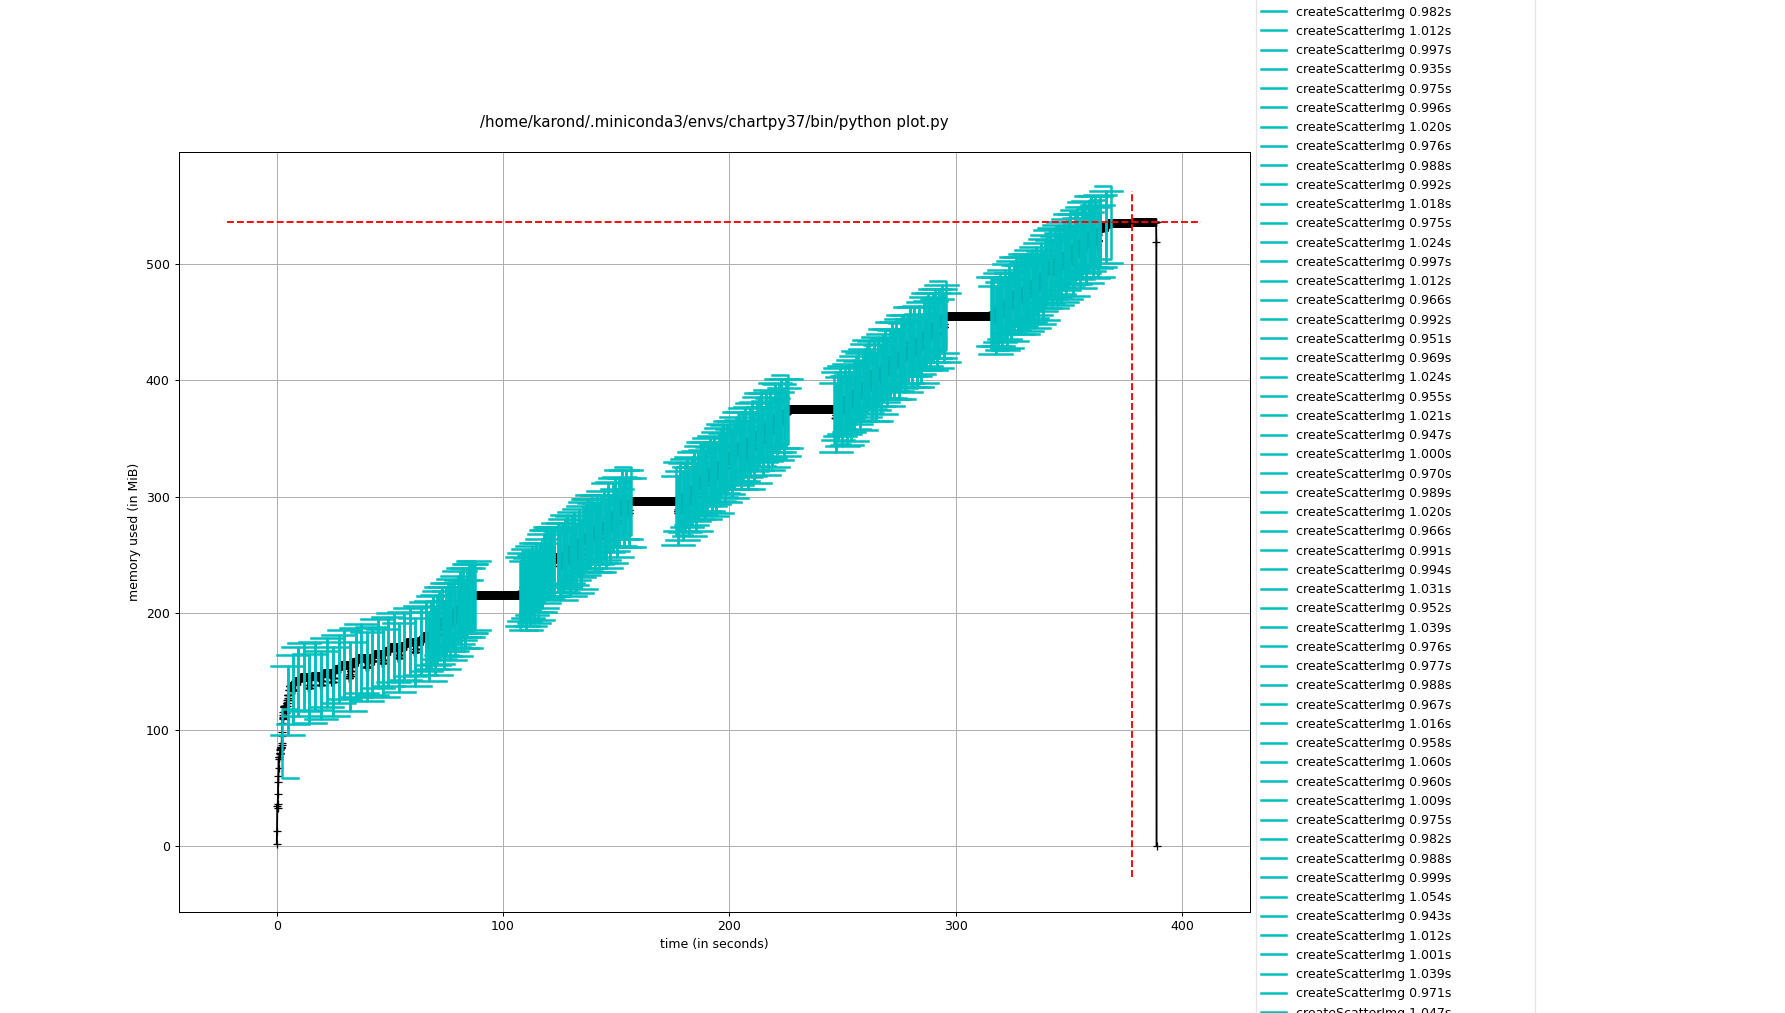
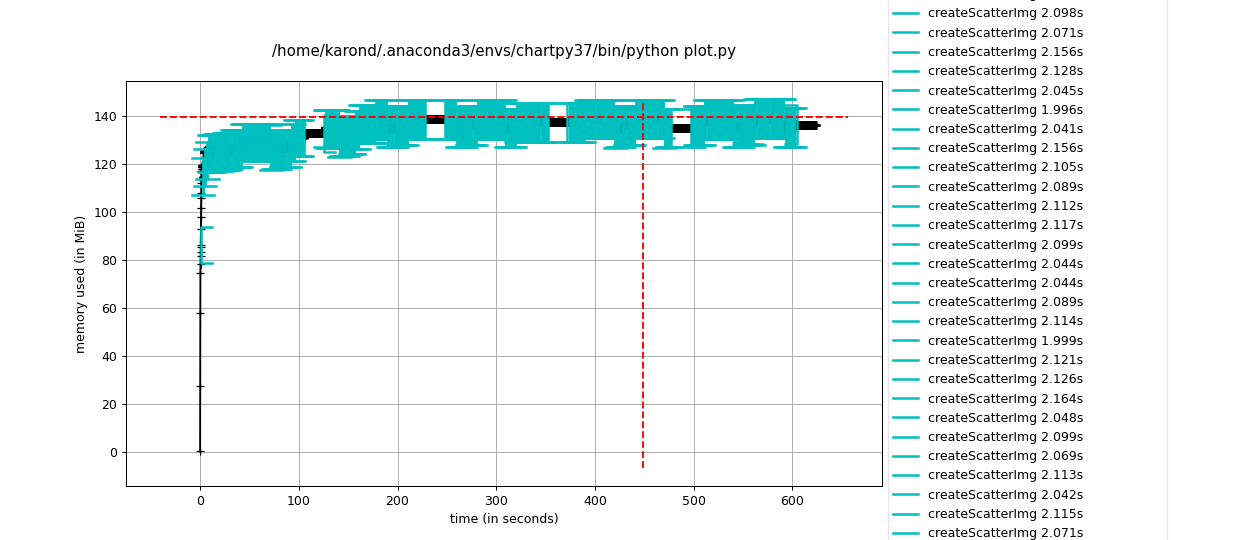
运行测试mprof run plot查看结果mprof plot

第二步找到泄漏点
上 fil-profilepip install filprofiler
开始分析fil-profile run plot.py
目录下多了一个文件夹,打开html文件查看结果

将所有创建figure的地方添加frameon参数figure=plt.figure(figsize=(8, 6),frameon=False)
不行,这参数名不副实啊
发现官方更加推荐使用from matplotlib.figure import Figure来代替plt.figure,再次测试一下
因为plt.figure造成的问题没有了,但是plt.savefig保存图片的这一句代码依然存在问题

看一下Matplotlab的源代码,gcf获取一个figure,如果没有的话使用plt.figure创建,淦,又是这个东西
matplotlib/pyplot.py:852
def gcf():
    """
    Get the current figure.

    If there is currently no figure on the pyplot figure stack, a new one is
    created using `~.pyplot.figure()`.  (To test whether there is currently a
    figure on the pyplot figure stack, check whether `~.pyplot.get_fignums()`
    is empty.)
    """
    manager = _pylab_helpers.Gcf.get_active()
    if manager is not None:
        return manager.canvas.figure
    else:
return figure()我们将plt.savefig修改成figure.savefig官方推荐用Figure来代替plt.figure,我听劝
现在plt.savefig的问题解决了,但是有有新的了

根据网上的资料发现Matplotlib的后端分成了互动式和非互动式
- 互动式: GTK3Agg, GTK3Cairo, GTK4Agg, GTK4Cairo, MacOSX, nbAgg, QtAgg, QtCairo, TkAgg, TkCairo, WebAgg, WX, WXAgg, WXCairo, Qt5Agg, Qt5Cairo
- 非互动式: agg, cairo, pdf, pgf, ps, svg, template
